Examples

Everyday challenges.
Practical possibilities.

From a simple spreadsheet to an operational system, the approach should fit the need. These fictional examples and synthetic data illustrate possible deliverables, not actual customer work.

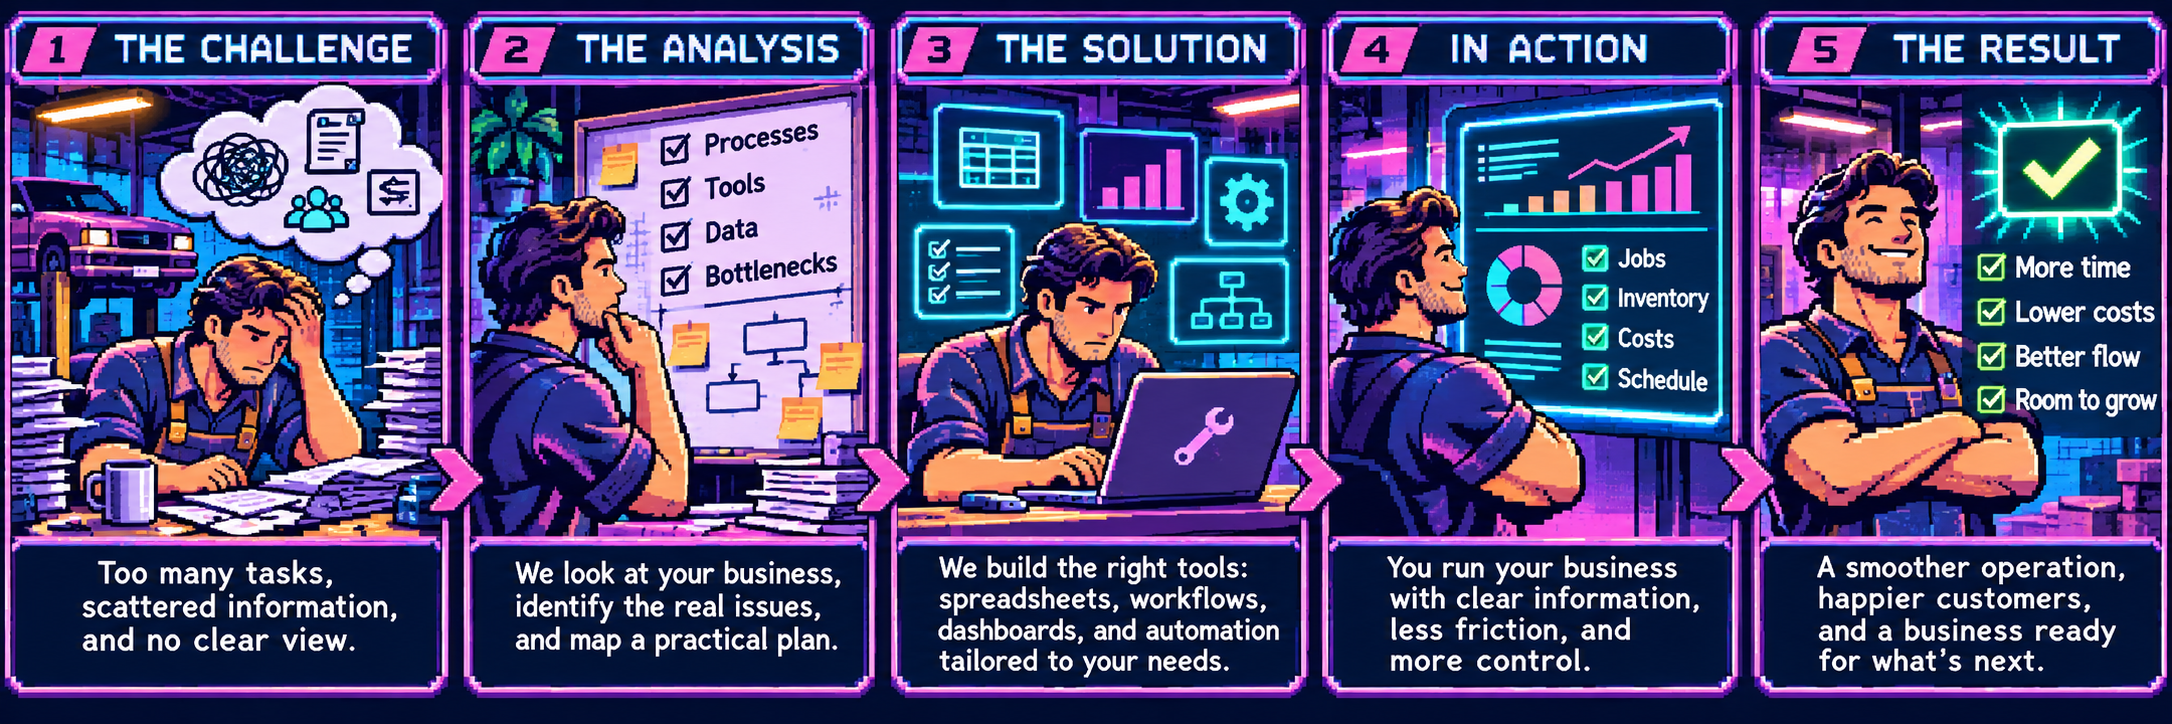
Five-panel pixel-art example: an overwhelmed business owner, analysis of processes and data, tailored tools, clearer daily operations, and more time and room to grow.

A / HOME BUSINESS PRICING

How many do I need to sell?

The problem. A home business owner has ingredient or material receipts but no consistent way to price products or track what a batch earns.

A possible solution. A spreadsheet brings materials, labor, packaging, and other batch costs into one pricing calculation.

The practical result. Compare a selling price with unit cost, then track revenue and the amount left after the batch costs entered.

Interactive illustration · Fictional USD amounts. This simplified example excludes any costs and taxes you have not entered. It does not store or send your inputs.

A PRACTICAL NEXT STEP

Compare a few selling prices, then check that every relevant cost is included before setting your price.

Help me understand my pricing

YOUR BATCH AT A GLANCE

Sell 6 units to cover this batch.

Fictional · USD
Try a price

Change price or units sold to update the graph instantly.

$24.00left after entered batch costs
USD $0$36$72 0612 Units sold from this batch
Sales revenue $60.00Full batch cost $36.00

◉ Current sales: 10 units · ◆ Break-even: 6 units

The batch is already made, so its full cost stays fixed as units sell. The ring marks your current sales.

Sell 6 of 12 units at $6.00 to cover the entered batch costs.

Edit batch costs and size

Include labor, packaging, and overhead in other batch costs.

Unit cost $3.00

Sales revenue $60.00

Profit after entered batch costs $24.00

B / INDEPENDENT BUSINESS REPORTING

Am I keeping more of what I earn?

The problem. An independent professional has invoices, receipts, and payment records in different places.

A possible solution. Organize the records in a spreadsheet, check categories and totals, and prepare a concise monthly report.

The practical result. A usable summary of money received, recorded expenses, and unpaid invoices, with a repeatable update process.

A PRACTICAL NEXT STEP

Review the unpaid invoices and rising expense categories before planning next month’s spending.

Help me understand my monthly numbers

SIX-MONTH CASH VIEW

More coming in. Less left in June.

Fictional · USD
June cash surplus$3,800Cash received less recorded expenses
Change from May−$100Expenses rose faster than receipts
USD · monthly totals $0$4K$8K JanFebMarAprMayJun ShortfallLatest Fictional months · January–June
June cash in$6,200June cash out$2,400

March had a $300 cash shortfall. June receipts recovered, but expenses rose $700 from May while receipts rose $600.

Fictional January–June totals. Cash surplus excludes unpaid invoices and is not an audited profit figure. June unpaid invoices: $1,100.

View the monthly data
Fictional monthly cash summary · USD
MonthCash inCash outSurplus / shortfallUnpaid invoices
Jan$4,200$1,200$3,000$700
Feb$4,600$1,350$3,250$800
Mar$1,800$2,100−$300$1,600
Apr$4,800$1,450$3,350$900
May$5,600$1,700$3,900$600
Jun$6,200$2,400$3,800$1,100

Sample output · Cash summary, not an audited statement. Unpaid invoices are shown separately and are not added to payments received.

C / ASSOCIATION & NONPROFIT REPORTING

What has our funding supported?

The problem. Membership, attendance, and program spending are recorded separately, making a committee update difficult to prepare.

A possible solution. Create a shared reporting template with agreed measures and a clear monthly program summary.

The practical result. A consistent update for a board, committee, or funding discussion, with gaps and remaining funds easy to see.

A PRACTICAL NEXT STEP

Compare the remaining $1,350 with planned activities and any funding restrictions before committing it.

Help me explain our funding and activity

COMMUNITY PROGRAM SNAPSHOT

$1,350 remains for what comes next.

Fictional quarter
84Active members
6Activities held
126Attendance visits
Program funding: $2,650 spent, 66.25%; $1,350 remaining, 33.75%, of $4,000 total.

Program spending$2,650

Funding remaining$1,350

Of $4,000 in total funding

21 attendance visits per activity, on average. Bring participation and funding into the same conversation.

Synthetic quarterly summary · Visits are not unique people. *Percentage rounded; all spending shown is charged to this allocation.

View the program data
Synthetic community association · Program summary (USD)
MeasureThis quarter
Active members84
Activities held6
Attendance visits126
Program funding$4,000
Program spending$2,650
Funding remaining$1,350

Sample output · Attendance counts visits, not unique people. Funding remaining assumes all spending shown is charged to this funding allocation.

D / ADVANCED BUSINESS OPERATIONS

A clearer view of complex work.

The problem. Work status, performance, and follow-ups are spread across operational records.

A possible solution. Dashboards and custom workflows bring relevant information together around existing systems.

The practical result. A focused view of performance, blocked work, and next actions. These existing demonstrations show several parts of that approach.

Dashboards & reports

Are we on track for the month?

Bring sales, costs, and performance together so you can spot a change and decide where to look next.

SALES / FICTIONAL MONTH TO DATE

$45,601behind expected pace
$0$400k$800k
Actual sales
$716,304
Expected pace
$761,905
Monthly target
$800,000

$83,696 still to target. At 89.5% of goal, the business is nevertheless behind the expected pace for this point in the month.

Synthetic demo · Aug 1–29 · USD. Pace is a comparison point, not a forecast.

A PRACTICAL NEXT STEP

Review ready-to-deliver work and the remaining sales pipeline against the gap.

Help me see my sales performance

Workflows & applications

Where is work getting stuck?

See open jobs, missing information, and work waiting on the next step in one place.

BACKLOG / FICTIONAL SNAPSHOT

14 jobswaiting for parts for 8+ days
Jobs by stage × days waiting
Stage0–2days3–7days8–14days15+days
Intake
Approval
Parts
Repair
Ready

Fewer jobsMore jobs

Select a cell to see a follow-up. Counts are jobs, not percentages.

Parts · 15+ days · 8 jobs

Ask purchasing to confirm supplier dates and alternatives for the missing parts.

Start with the parts queue. It has the largest group waiting at least eight days.

67 fictional jobs, each in one stage and age bucket. Days measure waiting in the current stage. Eight days is an illustrative review threshold, not a service standard. Separate scenario from the screenshot below.

A PRACTICAL NEXT STEP

Review the oldest parts cases with purchasing, assign an owner, and agree on the next follow-up.
Help me find my bottlenecks

Alerts & follow-ups

What could delay this job?

Flag overdue orders, missing dates, or unresolved credits so your team knows what needs attention.

PARTS / FICTIONAL FOLLOW-UPS

2 daysbetween the required and expected bumper-cover dates
Aug 31Sep 1Sep 2
Front bumper cover

Required Aug 31 → expected Sep 2 2-day gap

Bumper reinforcement

Required & expected Aug 31

Bumper absorber

? No single expected date

One item is expected after it is needed; another has no date. Confirm both before promising a job completion date.

Synthetic demo · RO 81353 · Dates in 2026. The timeline compares required and expected dates, not confirmed arrival.

A PRACTICAL NEXT STEP

Ask purchasing to follow up with Demo Bay OEM Supply on the bumper cover and identify a supplier and date for the absorber.

Help me organize follow-ups

Screenshots from a collision-repair demo with synthetic data. Each illustrates an idea we can adapt to your business.

Built around your working day

What are you still
doing the hard way?

A spreadsheet, a report, or a larger system can all start with a short description of what you need. No technical brief required.

Tell us what you need

Example screenshot

Synthetic data